2. Measuring Privacy Risks
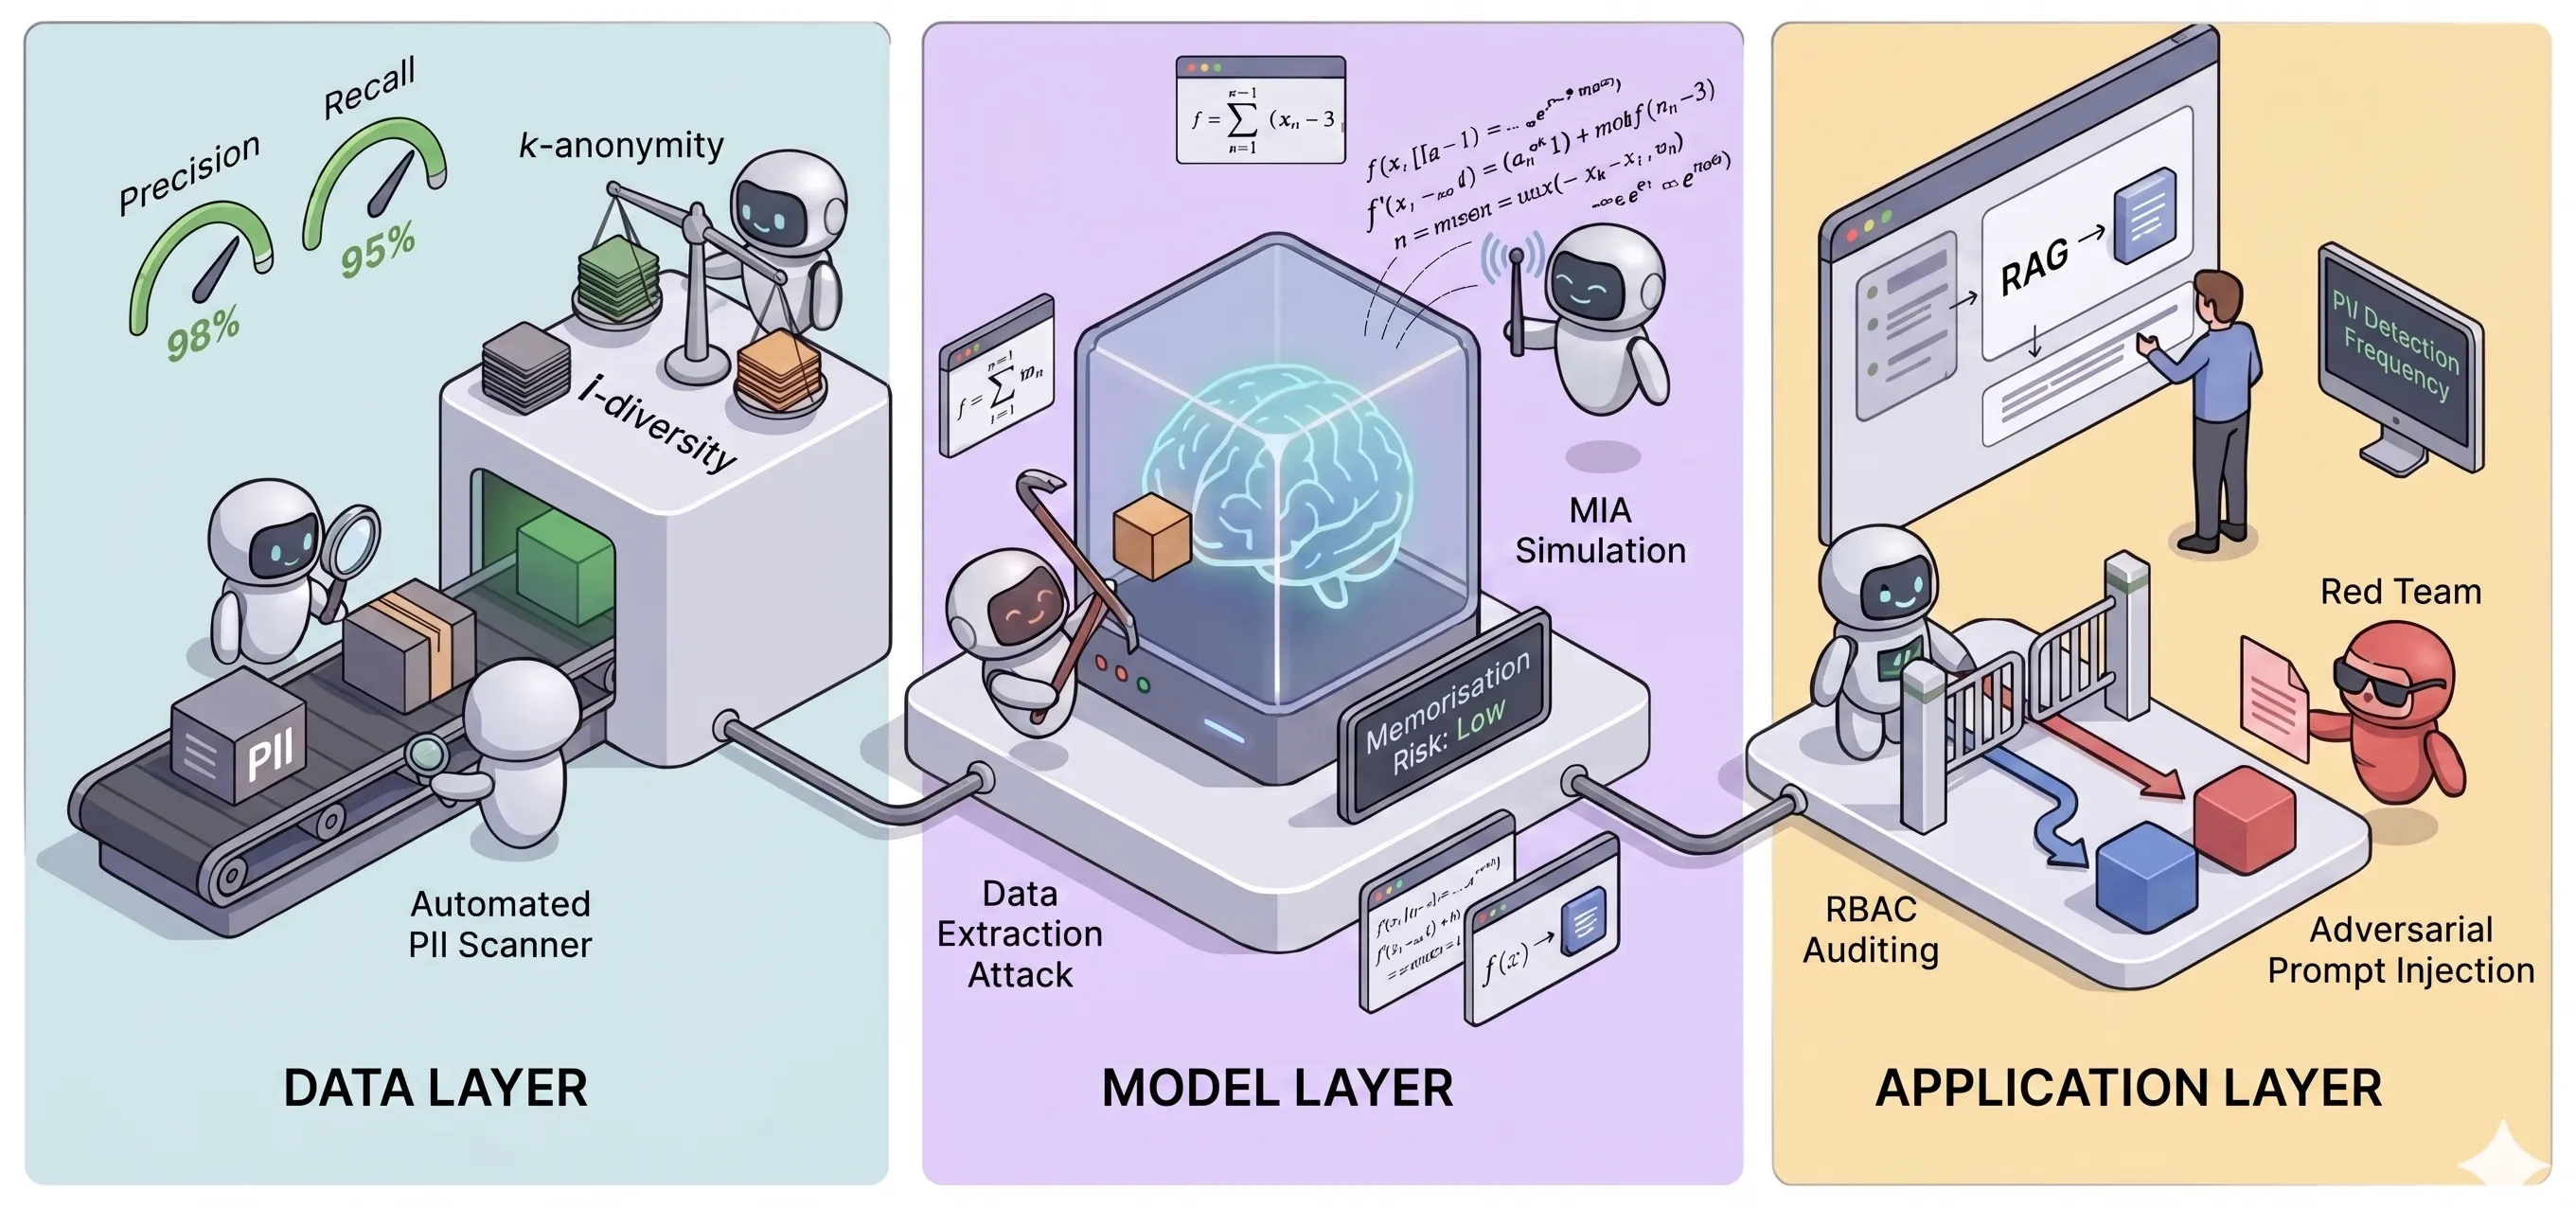
Measuring privacy risks across the three layers of the AI lifecycle (Data, Model, and Application). Image generated with Gemini.
Having identified where privacy vulnerabilities emerge, from PII embedded in data to model memorisation and user interactions, the next critical step is quantification. In the era of generative AI and foundation models, privacy can no longer be treated as a static compliance checkbox; it is a dynamic property that must be evaluated across the entire lifecycle of an AI system.
📊 Data Layer
Section titled “📊 Data Layer”AI models are reflections of their training data. If privacy is compromised at ingestion, the downstream consequences are baked into the system. The core data-layer privacy risk is individual-level linkage, which refers to the possibility that information can be associated with the same individual by reasonable means. Individual-level linkage can manifest through several mechanisms:
- Re-identification: linking data back to a uniquely identifiable individual.
- Attribute inference: deducing sensitive attributes (e.g., health conditions, income level) about an individual from the data, even without identifying them by name.
- Dataset membership disclosure: determining that an individual belongs to a particular dataset or group, where that membership itself is sensitive (e.g., a disease registry or welfare recipient list).
To measure the extent of individual-level linkage risk in datasets, rigorous baseline measurements can be implemented. The following are key techniques to quantify these risks at the Data Layer:
1. Automated PII Scanning
Section titled “1. Automated PII Scanning”Before training or fine-tuning, datasets must be screened to measure the density and types of PII present. Deterministic rules, like regular expressions, are effective for standard formats with consistent patterns (e.g., NRIC numbers). For unstructured text containing context-dependent PII (e.g. person names, organisations, locations), Named Entity Recognition (NER) models and language models can be used for identification.
Metrics:
- Recall: Measures the percentage of actual PII successfully detected by the scan. Maximising Recall minimises false negatives, ensuring comprehensive coverage of sensitive data in the dataset.
- Precision: Measures the percentage of flagged text that was actually PII. Maintaining high Precision minimises false positives, reducing noise in scan results.
- F1 Score: The harmonic mean of Precision and Recall, providing a single, unified metric to evaluate the overall detection performance of the PII scan.
2. Quantifying Re-identification Risk in Structured Data
Section titled “2. Quantifying Re-identification Risk in Structured Data”Even within de-identified datasets, attackers can execute linkage attacks by cross-referencing quasi-identifiers (such as Age, Gender, and Zip Code) with auxiliary public records to re-identify individuals.
Metrics:
- k-anonymity (Quantifying Identity Disclosure Risk): This metric calculates k, the size of the smallest “equivalence class” (the number of records sharing identical combinations of quasi-identifiers). It bounds the maximum probability of a successful linkage attack to 1/k. When k is 1, individuals can be uniquely singled out, representing an absolute failure of anonymity and the maximum risk of identity disclosure.
- l-diversity (Quantifying Attribute Disclosure Risk): This metric evaluates the variety of sensitive attributes (e.g., medical diagnoses) within each equivalence class to measure susceptibility to a homogeneity attack. By calculating l, the number of distinct (or proportionally well-represented) sensitive values in a group, it quantifies the risk of an attacker deducing a sensitive trait. A low l score indicates a high risk of attribute disclosure, even if the individual’s exact identity is hidden within a k-anonymous crowd.
- t-closeness (Quantifying Semantic Proximity Risk): This metric calculates the mathematical distance (commonly using the Earth Mover’s Distance) between the distribution of a sensitive attribute within a specific equivalence class and its global distribution across the entire dataset. This distance, t, quantifies the risk of a skewness attack. A large t value signifies a severe privacy leak, indicating that an attacker would infer significant new sensitive information simply by determining which equivalence class an individual belongs to.
3. Quantifying Attribute Inference Risks in Unstructured Text
Section titled “3. Quantifying Attribute Inference Risks in Unstructured Text”Unstructured text data (such as chat transcripts, medical notes, or social media posts) can implicitly leak sensitive traits through linguistic patterns, vocabulary, and semantic context. Even if explicit PII is scrubbed, attackers can exploit these latent signals to infer hidden attributes like political affiliation, age, gender, or mental health status. To quantify this risk, Large Language Models (LLMs) can be prompted to act as adversaries to simulate attribute inference attacks, or classifiers can be trained to predict these hidden attributes from the sanitised text.
Metrics:
- Adversary Advantage: Calculate the difference between the attack model’s prediction accuracy and the baseline probability (the natural base rate of the attribute within the population). A high advantage score indicates that the unstructured text contains strong, discernible contextual clues that significantly assist the attacker in profiling individuals beyond random guessing.
- Inference Accuracy: Measures the raw percentage of sensitive attributes that the adversary model correctly deduces from the text. When measured across different demographic groups, it also helps identify if certain populations are disproportionately vulnerable to textual profiling.
🧠 Model Layer
Section titled “🧠 Model Layer”Machine learning models, particularly Large Language Models (LLMs) and diffusion models, possess a well-documented tendency to memorise their training data. This memorisation occurs due to immense parameter capacities, the repetitive nature of training corpora, and objective functions (like next-token prediction) that penalise deviations from the training set. The following are key techniques to quantify privacy risks at the Model Layer:
1. Data Extraction Attack Simulations
Section titled “1. Data Extraction Attack Simulations”Simulate automated extraction attacks against the generative model to determine if the generative model will leak sensitive training data verbatim. Depending on the model’s modality, this can involve divergence attacks (prompting the model with repetitive tokens to break its alignment) and prefix-matching (providing the first half of a known sensitive document to see if the model completes it) for text-based LLMs, or noise-space manipulation and targeted prompting for image and audio models, coercing them into producing exact copies of their training distributions.
Metrics:
- Exact Extraction Rate: The percentage of targeted sensitive records successfully extracted.
- k-eidetic Memorisation Score: Categorises extracted data based on its frequency in the training corpus. A string is considered k-eidetic memorised if it can be successfully extracted despite appearing k or fewer times in the training data. A lower k (e.g., _k=1+, meaning the model memorised a record after seeing it only once) indicates a severe privacy risk.
2. Membership Inference Attack (MIA) Simulations
Section titled “2. Membership Inference Attack (MIA) Simulations”Simulate MIAs to quantify the probability that an attacker can mathematically deduce whether a specific individual’s data record was included in the model’s training set. This leverages how models generally exhibit higher confidence (lower loss or perplexity) on data they have seen before. To simulate MIA, shadow models can be trained to mimic the target model’s behaviour, establishing expected loss distributions to distinguish members from non-members of the training set.
Metrics:
- True Positive Rate at Low False Positive Rate (TPR @ FPR): For example, measuring the TPR when the FPR is fixed at 0.1%. High TPR at a low FPR indicates a severe, practically viable privacy vulnerability.
- Receiver Operating Characteristic Area Under the Curve (ROC-AUC): Measures the overall discriminative capability of the MIA. A score of 0.5 means no risk (random guessing); approaching 1.0 means absolute certainty.
3. Model Inversion Attack Simulations
Section titled “3. Model Inversion Attack Simulations”Simulating a model inversion attack involves iteratively modifying input data until the target model predicts a specific, sensitive class with maximum confidence, effectively reconstructing the hidden training data. In a white-box scenario, where the attacker has full access to the model’s internal parameters, this is achieved by feeding random noise into the model and using gradient ascent to directly optimise the input pixels until the desired output is reached. Conversely, in a black-box scenario where only the model’s outputs are accessible, attackers utilise search-based techniques like adaptive hill climbing or evolutionary algorithms to iteratively query the target model and refine the input data, successfully reconstructing sensitive training data without needing access to the model’s internal parameters.
Metrics:
- Attack Success Rate: This evaluates whether an independent classifier (an evaluation model) correctly identifies the reconstructed image as the target identity. A high attack success rate indicates a severe privacy leak.
- Feature Distance (e.g., Cosine Similarity or L2 Distance): This measures the mathematical distance between the reconstructed data and the original training data within a latent feature space. A shorter distance means the extracted data is dangerously close to the original.
- Structural Similarity Index Measure (SSIM): Used primarily for image data, SSIM measures the perceptual similarity between the attacker’s reconstructed image and the actual training image, looking at changes in structural information, luminance, and contrast.
- Peak Signal-to-Noise Ratio (PSNR): Another image-quality metric that quantifies the reconstruction quality. Higher PSNR values indicate less distortion between the reconstructed image and the original source data.
🚀 Application Layer
Section titled “🚀 Application Layer”This layer encompasses how the application processes user inputs, integrates with underlying AI models and external data pipelines (such as in Retrieval-Augmented Generation (RAG) architectures), and delivers the final predictions or generated outputs.
1. Adversarial Testing and Red Teaming
Section titled “1. Adversarial Testing and Red Teaming”Continuously evaluate applications against adversarial threats. Testers use crafted inputs (e.g., adversarial examples or prompt injections) to attempt to bypass guardrails, tricking the AI into revealing sensitive contextual data, proprietary system rules, or private session data.
Metrics:
- Attack Success Rate: The percentage of adversarial attacks that successfully bypass guardrails to extract targeted sensitive information.
- Mitigation Latency: The average time taken to deploy updated input filters or prompt wrappers after a successful injection is identified.
2. Data Boundary and Access Control Auditing
Section titled “2. Data Boundary and Access Control Auditing”Validate the strict enforcement of Role-Based Access Controls (RBAC) across the AI system’s data integrations. Users should only leverage or infer insights based on data they explicitly have permission to view. In RAG architectures, this requires auditing the vector database to ensure that semantic searches are strictly bound by index-level metadata filtering.
Metrics:
- Adversarial Success Rate: The percentage of simulated attempts that successfully extracts targeted sensitive information. For example, using an automated agent to attempt to query the RAG system for specific canary documents (sensitive files placed in the database) using accounts without permission should have an adversarial success rate of 0%.
3. Telemetry and Output Monitoring
Section titled “3. Telemetry and Output Monitoring”Implement continuous output monitoring to detect and measure the frequency of PII, restricted information, or anomalous data patterns in the application’s outputs. This also quantifies the effectiveness of output guardrails if there are any in place.
Metrics:
- Frequency and Volume of Exposed Data: The rate of PII, restricted information, or anomalous data patterns inadvertently exposed in system outputs.
4. Privacy Assessment for AI Agents
Section titled “4. Privacy Assessment for AI Agents”Auditing has to rigorously quantify the risk of the agent over-fetching or transmitting restricted data to untrusted parties.
Metrics:
- Unauthorised Tool Invocation Rate: The frequency with which adversarial prompts successfully trick the agent into executing a privileged API call or tool to access sensitive data.
- Frequency and Volume of Exposed Data: The rate of PII or restricted information is inadvertently retrieved by the agent and leaked to the user, alongside the total volume of records exposed per incident.
- Third-Party Sensitive Data Transmission Rate: The frequency with which the agent sends sensitive internal context or user data to untrusted external tools or third-party APIs in an attempt to complete a task.