4. Quality Evaluation of Synthetic Data
As OpenAI’s Greg Brockman stated: “Evals are surprisingly often all you need ” This applies directly to synthetic data—evaluation determines whether generated data meets real-world needs.
Standardized evaluation typically covers utility (downstream usefulness), fidelity (statistical similarity) and privacy. However, getting a practical, detailed, and tailored assessment requires broader evaluation. There is no universal definition of “good” synthetic data: what counts as good depends on the use case (e.g., anomaly detection needs minority/outlier fidelity) and the domain’s obligations (e.g., government, healthcare, finance require rigorous privacy testing).
What Quality Dimensions Should You Evaluate?
Section titled “What Quality Dimensions Should You Evaluate?”Here’s a practical set of evaluation dimensions to help you choose strategies that match your specific context:
| Dimension | What’s being evaluated? | Example Approaches |
|---|---|---|
| Fidelity (Similarity) | How closely does synthetic data mimic the real data distribution? | Compare statistics, check correlations, visual comparisons (e.g., Kolmogorov-Smirnov test, correlation matrices) |
| Utility (Usefulness) | How useful is synthetic data for downstream analysis (machine learning, statistical inference, etc.)? | Train models on both datasets, compare performance results (e.g., accuracy, F1-score, AUC) |
| Integrity & Domain Coherence | Does synthetic data preserve format, follow business rules, and make logical domain-specific sense? | Check data formats, validate business rules, expert review (e.g., schema validation, constraint checks) |
| Diversity & Coverage | Does synthetic data capture the full variability of the real dataset, including rare events and outliers? | Check rare cases, measure variety, count unique values (e.g., coverage metrics, outlier detection) |
| Fairness & Bias Mitigation | How does synthetic data handle representation across sensitive attributes or minority groups? | Compare group representation, check for balanced outcomes (e.g., demographic parity, equalized odds) |
| Generalization1 | Do patterns learned by a synthesizer transfer to unseen real-world data, domains, and time periods? | Test on new data, validate across time periods (e.g., cross-validation, temporal validation) |
| Privacy | What are the risks of exposing sensitive information? | Test for data leakage, check individual privacy protection (e.g., membership inference, reconstruction attacks, attribute inference) |
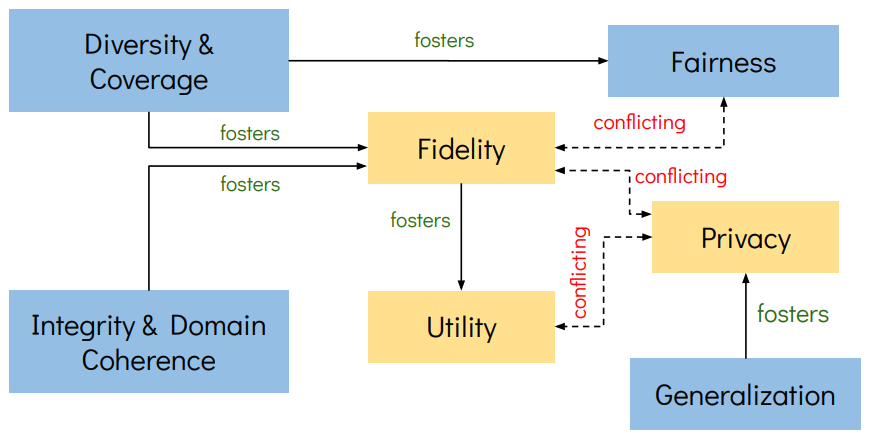
Figure: 1. Evaluation Dimensions and Trade-offs in Synthetic Data
Generation. The seven evaluation dimensions show directional relationships
where solid arrows indicate positive influences (improving the source
dimension fosters the target dimension) and dashed arrows show conflicting
influences (improving the source dimension may compromise the target).
Owing to the privacy risk evaluation importance in public-sector and other high-stakes settings, we have a dedicated chapter on it Privacy-preserving Synthesis.
How to Select Metrics for Dimension Evaluation?
Section titled “How to Select Metrics for Dimension Evaluation?”Metrics help you measure the quality of synthetic data across different dimensions, which then helps you determine if it will meet your specific needs. When selecting metrics for evaluation across the dimensions above, ensure your evaluation metrics have these characteristics:
- Multidimensional coverage: Assesses multiple quality aspects together such as fidelity, diversity, and fairness to spot potential conflicts early (e.g., when improving privacy hurts utility).
- Clear interpretability: Produces results that clearly communicate strengths, weaknesses, and trade-offs (what the metrics can measure, and what they fail to measure) to both technical teams and business stakeholders.
- Granular assessment: Goes beyond overall scores to examine how well synthetic data represents different subgroups and whether it contains unwanted biases or vulnerabilities.
- Reliable consistency: Generates stable, reproducible results by accounting for the randomness in synthetic data generation
- Practical flexibility: Works effectively even with limited real data for comparison, adapting to your actual constraints and dataset size.
Getting Started With Tabular Synthetic Data Evaluation
Section titled “Getting Started With Tabular Synthetic Data Evaluation”Several open-source Python packages provide comprehensive evaluation capabilities for getting started:
SDMetrics
Section titled “SDMetrics”Repository: https://github.com/sdv-dev/SDMetrics
from sdmetrics.reports.single_table import QualityReport
# generate quality reportqr = QualityReport()qr.generate(real_data=real_data, synthetic_data=synthetic_data, metadata=metadata)
qr_details = qr.get_details(property_name='Column Shapes')qr_fig = qr.get_visualization(property_name='Column Shapes')
MOSTLY AI Quality Assurance (QA)
Section titled “MOSTLY AI Quality Assurance (QA)”Repository: https://github.com/mostly-ai/mostlyai-qa
from mostlyai import qa
# generate quality report for single-table real and synthetic datasetsreport_path, metrics = qa.report(    syn_tgt_data = synthetic_data,    trn_tgt_data = training_data,    hol_tgt_data = holdout_data,  # optional)
# pretty print metricsprint(metrics.model_dump_json(indent=4))
# open up HTML report in new browser windowwebbrowser.open(f"file://{report_path.absolute()}")
YData Profiling
Section titled “YData Profiling”Repository: https://github.com/ydataai/ydata-profiling
from ydata_profiling import ProfileReport
# generate profiles for real and synthetic datasetsreal_profile = ProfileReport(real_data, title="Real Data Profile")synthetic_profile = ProfileReport(synthetic_data, title="Synthetic Data Profile")
# compare profilescomparison_report = real_profile.compare(synthetic_profile)
# save comparison reportcomparison_report.to_file("comparison_report.html")
The next chapter shifts focus to one of synthetic data’s most crucial and complex challenges: evaluating the privacy risks of synthetic data.
Footnotes
Section titled “Footnotes”-
Related to generalization, measuring flexibility introduced in the article “The fundamental trilemma of synthetic data generation”, which refers to how many use cases the synthetic data can address. Generally speaking, the higher the generalization, the greater the flexibility. ↩